

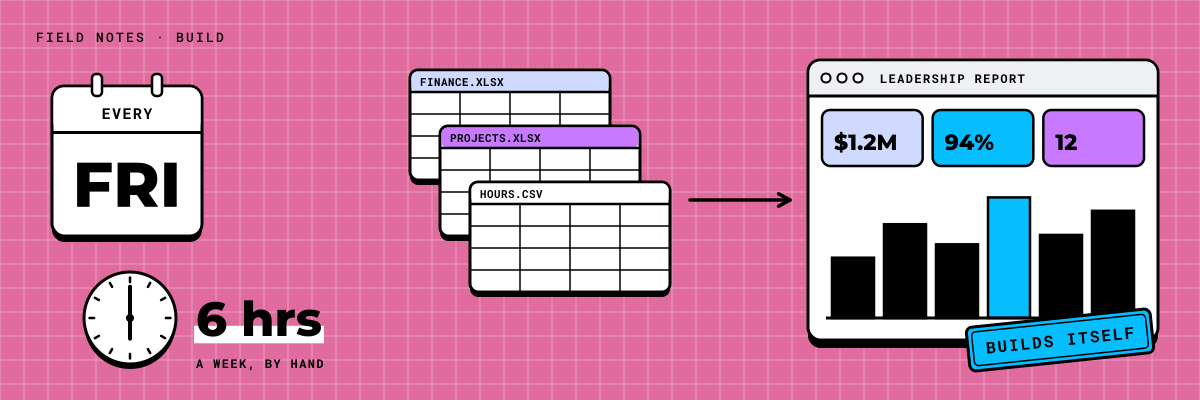
Every Friday, someone in your company opens three systems, exports three spreadsheets, and spends the afternoon stitching them together. By the end of the day, leadership has a report. By Monday, someone has questioned a number, and the person who built it spends another hour tracing where it came from.
This is one of the most common patterns we see in companies of 20 to 200 people. It rarely looks expensive, because it is one person's afternoon. Add it up and the picture changes.
Where the six hours go
In one scenario, an 80-person land services firm produced a weekly leadership report covering project status, utilization and cash. The data came from three places: the project system, the timesheet tool and the accounting package. None of them talked to each other.
The operations manager's Friday went roughly like this:
- An hour exporting from each system and cleaning up the columns.
- Two hours matching project codes, because each system spelled them a little differently.
- An hour building charts and copying them into a slide deck.
- An hour or more chasing late timesheets and fixing the numbers once they came in.
That is six hours a week, every week. Over a working year it is about 300 hours, close to two months of one person's time. At a loaded cost of around $75 an hour, that is more than $20,000 a year spent retyping numbers that already exist in your systems.
Plug in your own numbers to see what your version costs.
The hidden cost is trust
The hours are the easy part to measure. The bigger cost is what happens in the leadership meeting.
When a report is rebuilt by hand, small differences creep in. Finance has one revenue figure, operations has another, and the project leads have a third. The first 20 minutes of the meeting go to working out whose number is right. Decisions wait. Sometimes people stop looking at the report at all and go back to asking for updates by email.
A report nobody trusts is worse than no report, because it costs the same time to produce and still leaves leaders guessing.
Connect the systems once
The fix is not a better spreadsheet. It is connecting the three sources to one dashboard, once, and letting it refresh on its own.
For most companies on Microsoft 365, that means Power BI. The work looks like this:
- Connect to each source directly, using its built-in connector or a scheduled export to SharePoint where no connector exists.
- Build one shared list of project codes and clients so the three systems line up.
- Agree on the definitions leadership cares about: what counts as billable, when revenue is recognized, how utilization is calculated.
- Design a single page that answers the questions the Friday report was built to answer.
- Schedule it to refresh overnight and send a link to leadership each Friday morning.
Step three is where most of the value sits. Writing down the definitions forces the conversation that the manual report was quietly avoiding.
Before: six hours every Friday, three versions of the truth, and a meeting that starts with an argument. After: a dashboard that refreshes overnight, one set of numbers, and a meeting that starts with decisions.
What does it take to build?
For a report like the one in our scenario, the build usually takes two to four weeks, depending on how clean the source data is. Most of that time goes to matching codes and agreeing on definitions, not to building charts.
The person who used to build the report does not disappear. They become the owner of the dashboard, and their Friday afternoon goes to the questions the numbers raise instead of to producing the numbers. In the scenario above, that shift alone paid for the project within the first year.
This is the kind of work we like best: making the software you already pay for do the busywork, so your people can do the part that needs a person.
If you have a Friday report of your own, book the Scan. In 30 minutes we look at your Microsoft 365 and your reporting with you and put numbers on what it costs today.